Insights Dashboard
The insights section provides a comprehensive project level data overview of key Test Manager features, including Projects, Test Plans, Builds, and Test Cases, available at both the project and organizational levels.
- The insights is segregated on various parameters such as
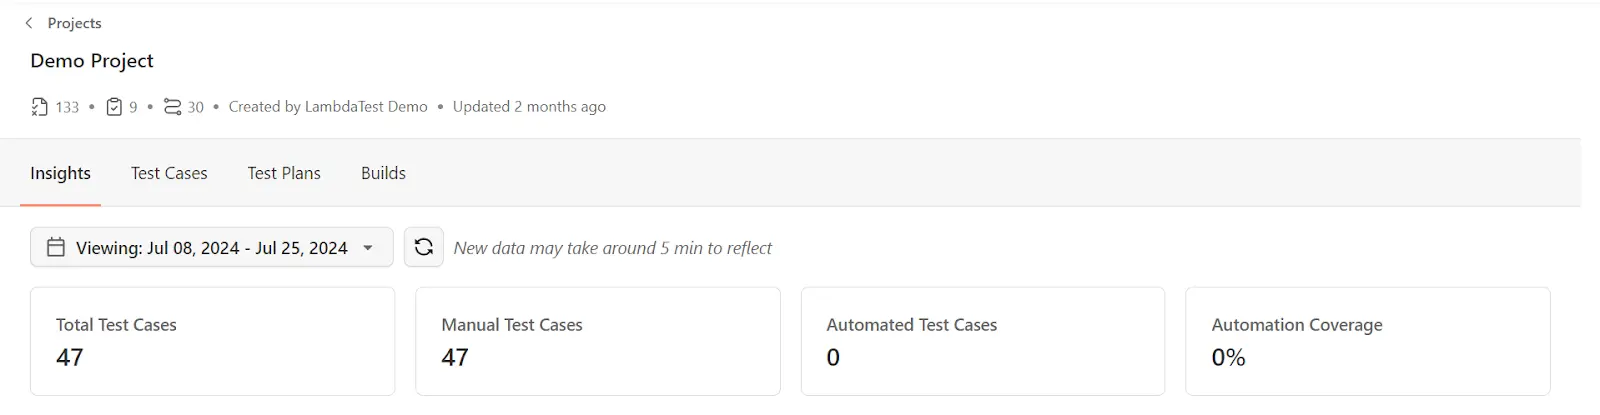
- Total Test Cases: Provides a count of all test cases created.
- Manual Test Cases Number of manual test cases
- Automated Test Cases Number of automated test cases.
- Automation Coverage Displays the percentage of test cases that are automated.
- You can filter test cases based on specific date ranges. For instance, you can view data from July 8th to July 25th to analyze trends over that period.
-
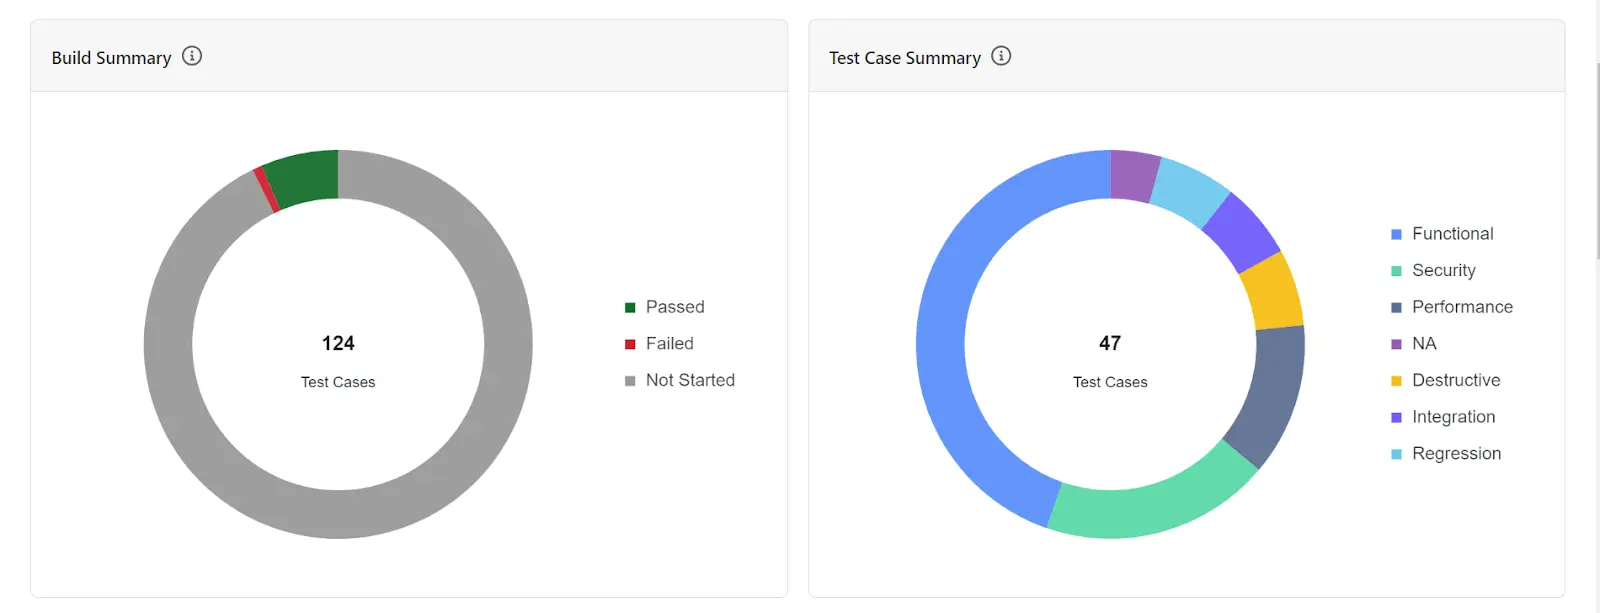
Build Summary provides details of test cases based on status that is whether the test cases have passed, Failed, Skipped or Not Started.
-
Test Case Summary provides information on the type of testing that has been chosen for different test cases.
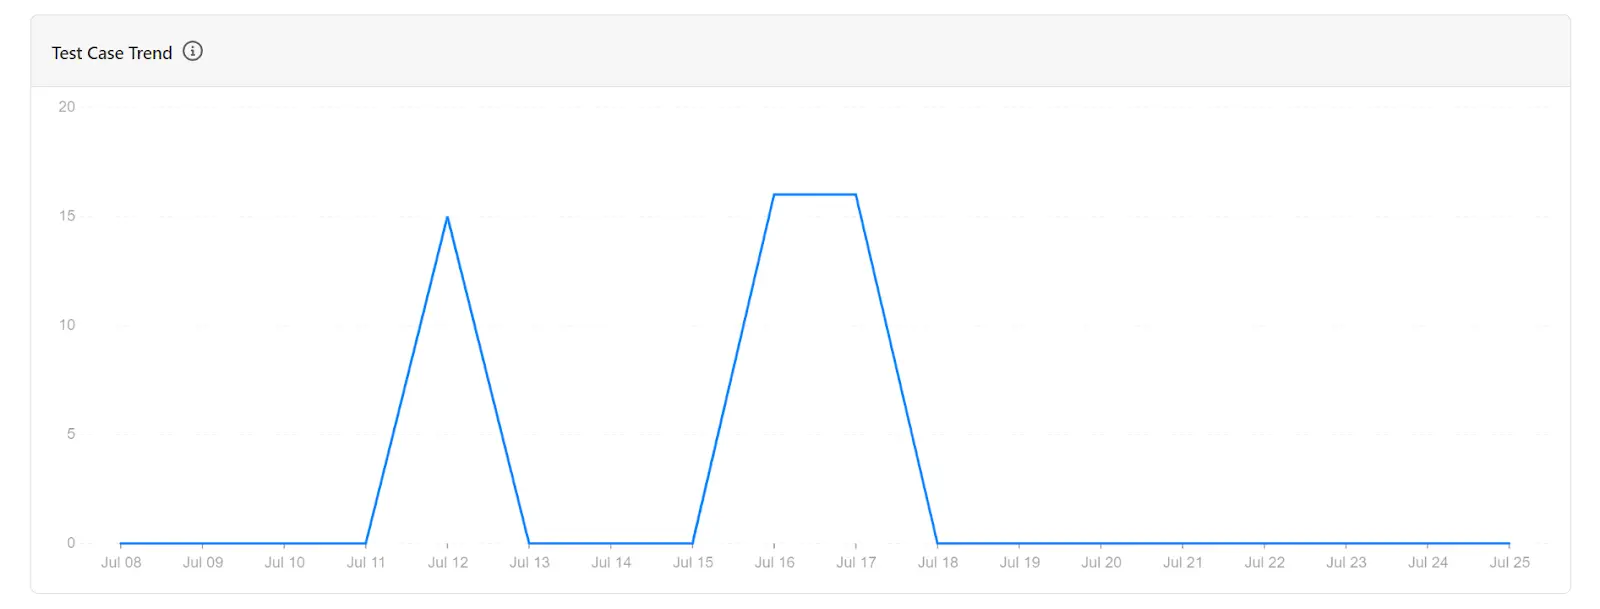
- Test Case Trend graphically represents the count of test cases created over the selected duration, offering a visual insight into test case progression and status.
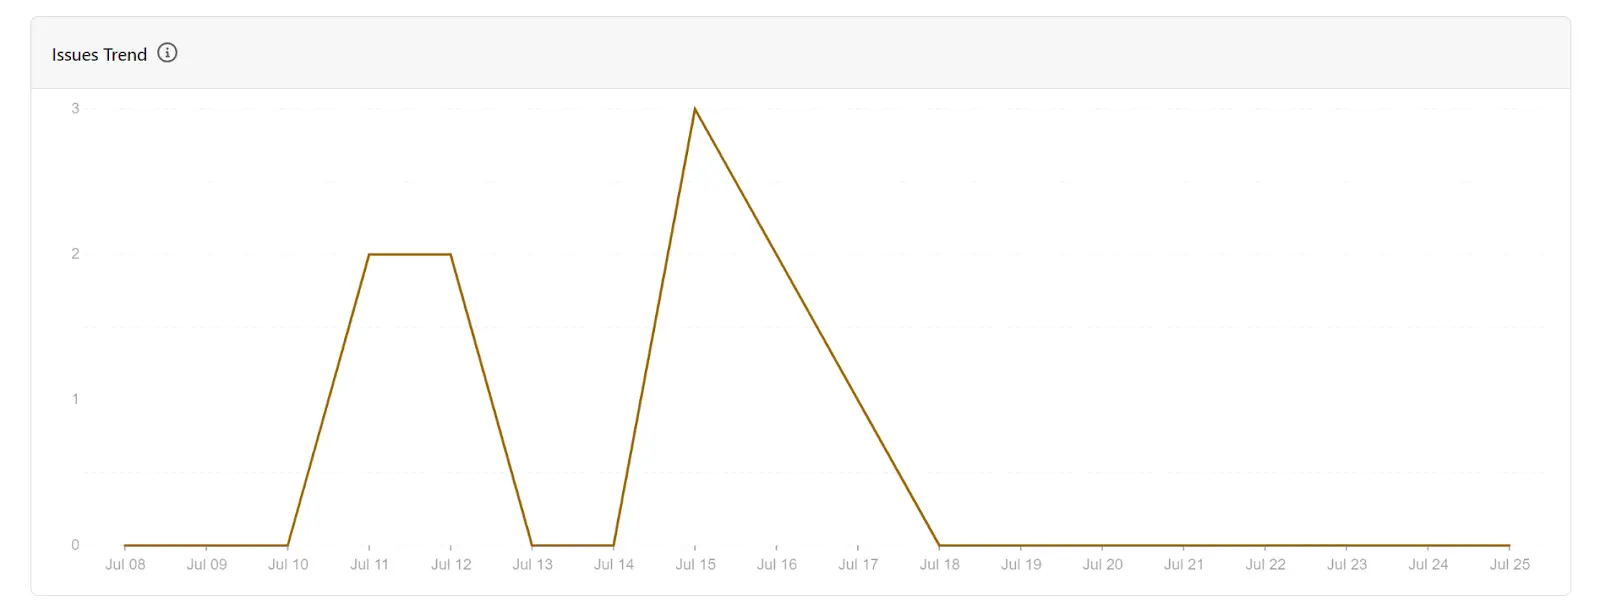
- Issues Trend provides an overview of issues linked to all test cases over the selected time frame. This helps in identifying areas that may require attention.
These insights help in monitoring and improving the testing process, ensuring comprehensive coverage and efficient test management.
